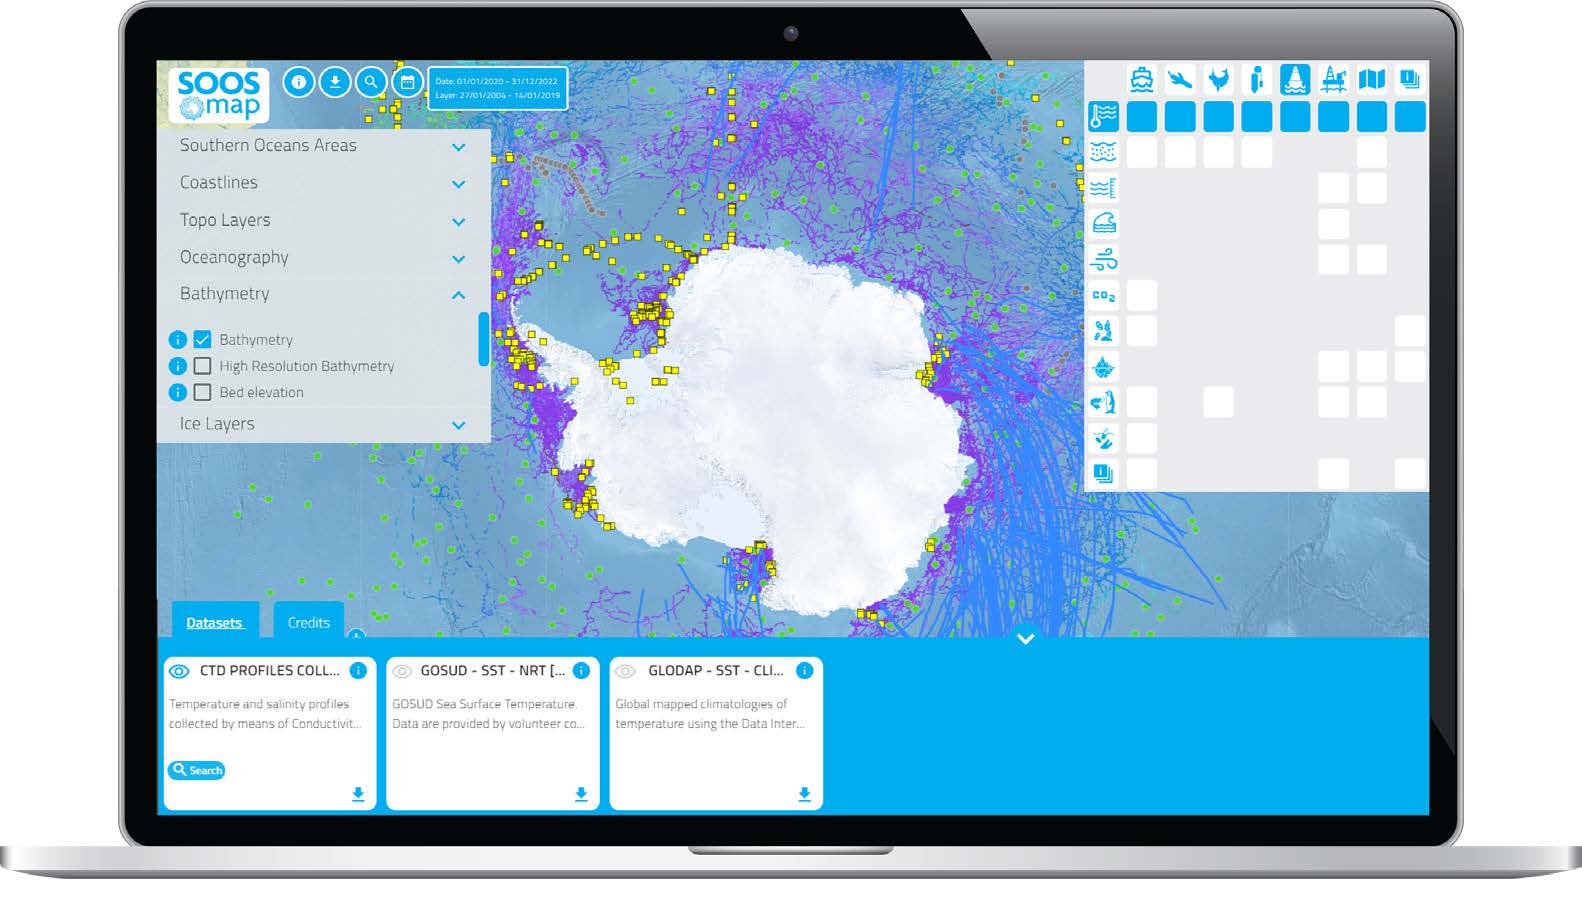
SOOSmap is an interactive web portal for oceanographic data visualisation and dissemination developed and hosted for SOOS by the European Marine Observations and Data Network (EMODnet) Physics. The portal is supported by the 'Southern Ocean Carbon and Heat Impact on Climate (SO-CHIC)' project and and the Horizon Europe 'Ocean-Cryosphere Exchanges in ANtarctica: Impacts on Climate and the Earth System (OCEAN ICE)' project.
SOOSmap serves up curated and standardised observation data from oceanographic and Antarctic research programs from many nations and scientific disciplines. It is built around individual observing platforms or sampling events (e.g. an Argo float or plankton trawl). Specifically, it allows users to discover and access circumpolar data coming from several international research centres and data assemblers, oceanographic repositories and marine infrastructures in the Antarctic.
Datasets are provided with metadata and are available in multiple data formats drawing from the extensive data holdings of Copernicus and EMODnet, which were collated for European seas but which cover global oceans. Additionally, SOOS is bringing in key datasets of particular value to the Southern Ocean, including krill, plankton, sea ice observations, DNA barcoding, plastics and many more. At the moment SOOSmap incorporates more than 50 data layers including over 50,000 observations.
All metadata is publicly available via the SOOSmap GeoNetwork Metadata Catalogue for easy discoverability.
We are working with data centres around the world to make SOOSmap a comprehensive source for marine observations from the Southern Ocean. Given the complex ecosystem of data centres and data aggregation efforts, this is no small task. SOOS and EMODnet are negotiating with individual data centres to improve our holdings of each observation type. Over time, you can expect both the number and type of observations to grow, as we develop these relationships. For more information or to help improve SOOSmap, please contact the SOOS data officer.
SOOSmap was successfully launched in October 2017 and a second, updated version was officially introduced in 2023. The data management architecture and the user interface of the SOOSmap platform were redesigned to offer a faster and smarter experience, a deeper and more accurate data exploration and a more interactive analysis. Explore SOOSmap by clicking the button above!
Last modified: 27/Januar/2026/JB


