
The International Thwaites Glacier Collaboration Examines the West Antarctic Ice Sheet and its Interactions with the Amundsen Sea Onboard the U.S. Research Icebreaker NB Palmer

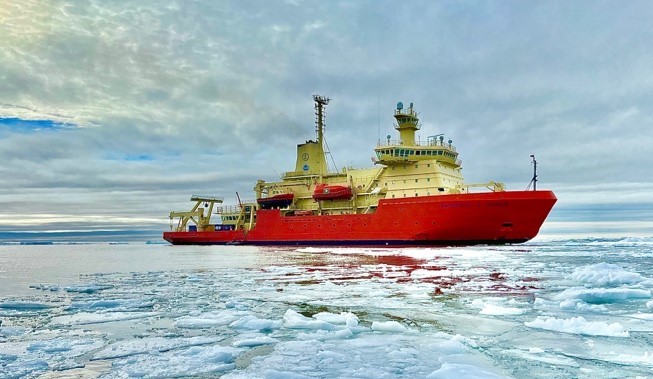
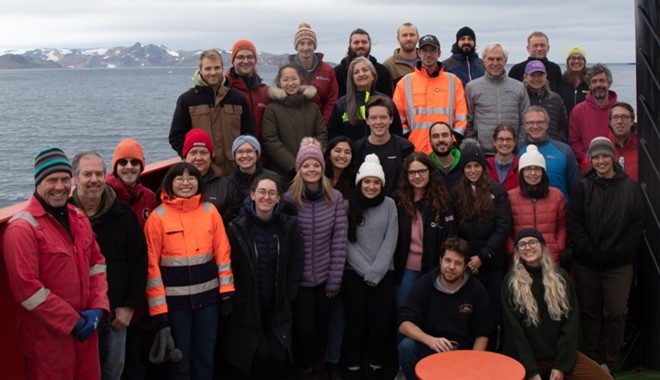
Following nearly a full month of quarantine for scientists and crew, the R/V Nathaniel B. Palmer (Figure 1) set sail from Punta Arenas, Chile on January 6, 2022 for a 65-day expedition to the Amundsen Sea Embayment (ASE). Primary science goals were to examine the ocean's interactions with the melting West Antarctic Ice Sheet (WAIS), with particular focus on the most rapidly changing Thwaites glacier (Scambos et al. 2017). An international team of 32 scientists were onboard (Figure 2): 20 from TARSAN, 8 from ARTEMIS, and 4 from THOR. Eleven members of the Antarctic Support Contract technical team and 20 ship's crew were also key contributors to our successful expedition.
Early in the expedition, co-chief scientists Patricia Yager and Robert Hall recognized that a powerful Amundsen Sea Low was making sea ice conditions in the eastern Amundsen Sea difficult for reaching the Thwaites. Not entirely surprised by this occurrence in the highly-variable ASE, we initiated "Plan B" to examine similar processes occurring at the Dotson and Getz Ice shelves, just "downstream" of Thwaites, all the while keeping an eye out for any favorable changes to the east.
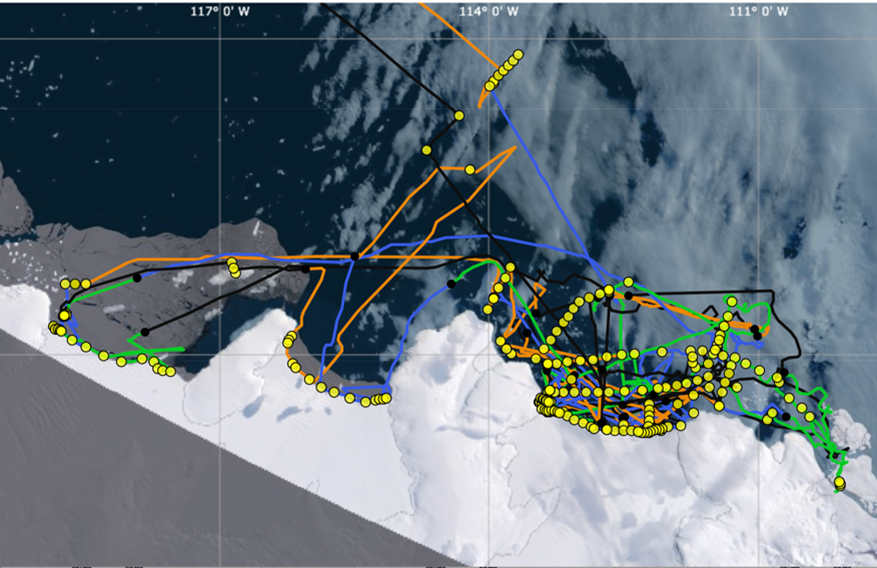
Our cruise track and daily sampling effort can be explored using a remarkable website (https://nbp2202map.com; see Figure 3) created by one of the TARSAN team members. The expedition combined an extraordinary array of autonomous underwater vehicles, including 5 Seagliders and 1 SeaExplorer completing more than 1300 dives, Autosub Long Range (ALR) collecting data for more than 90 hours of data under the ice shelf, and RAN (HUGIN) mapping more than 1000 km of ice shelf cavity geometry and for the first time bringing cavity water samples back to the ship for analyses. We also had an enhanced shipboard observation kit including a conventional CTD-rosette with augmented sensor package and Lowered Acoustic Doppler Current Profiler (LADCP), a trace-metal clean CTD-rosette with augmented sensor package and monocoring capability, a Vertical Microstructure Profiler (VMP) system, shipboard ADCP (SADCP), extensive underway data collection, and sediment coring with both Kasten and Mega cores. Nearly 300 CTD casts were made, ~250 VMP profiles collected, and 19 Kasten cores, 11 megacores, and 6 monocores were brought onboard for sediment analyses. A seal-tagging team placed sensors on 1 elephant seal and 20 Weddell seals that were transmitting data before we even left the region. By all measures, this was a very successful field effort!
One of the most exciting outcomes was the great interdisciplinary collaborations that developed between the three projects. It is highly unusual to have a complete physical oceanographic team sharing wire time with a full biogeochemistry effort and a coring team. The ultimate outcome of the effort will no doubt be greater than the sum of the parts.
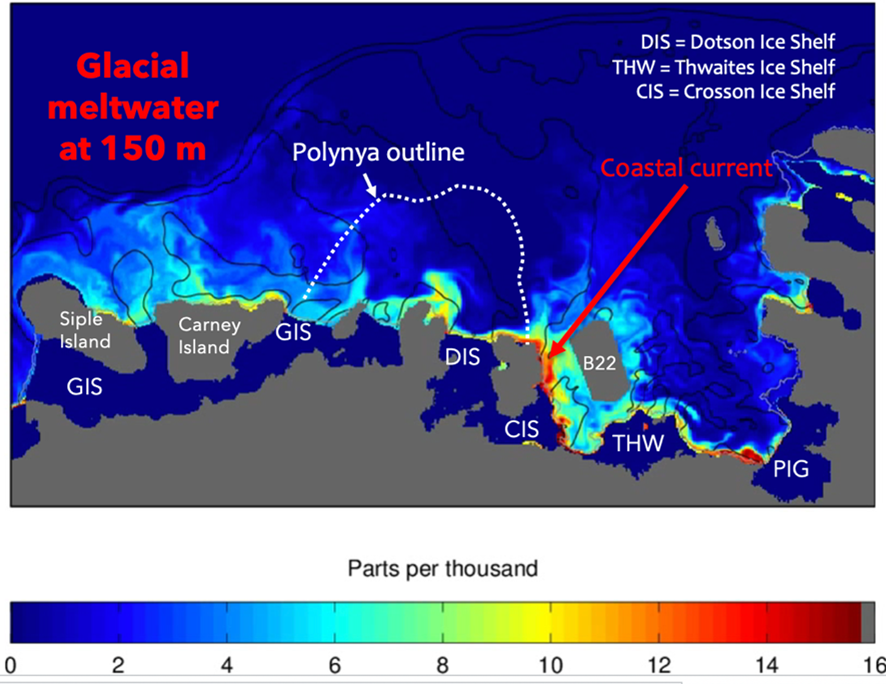
Another remarkable outcome was validation of a high-resolution numerical model for the region (St-Laurent et al. 2017, 2019; Figure 4). The meltwater-rich coastal current, in particular, and ice-shelf inflows and outflows were observed as predicted.
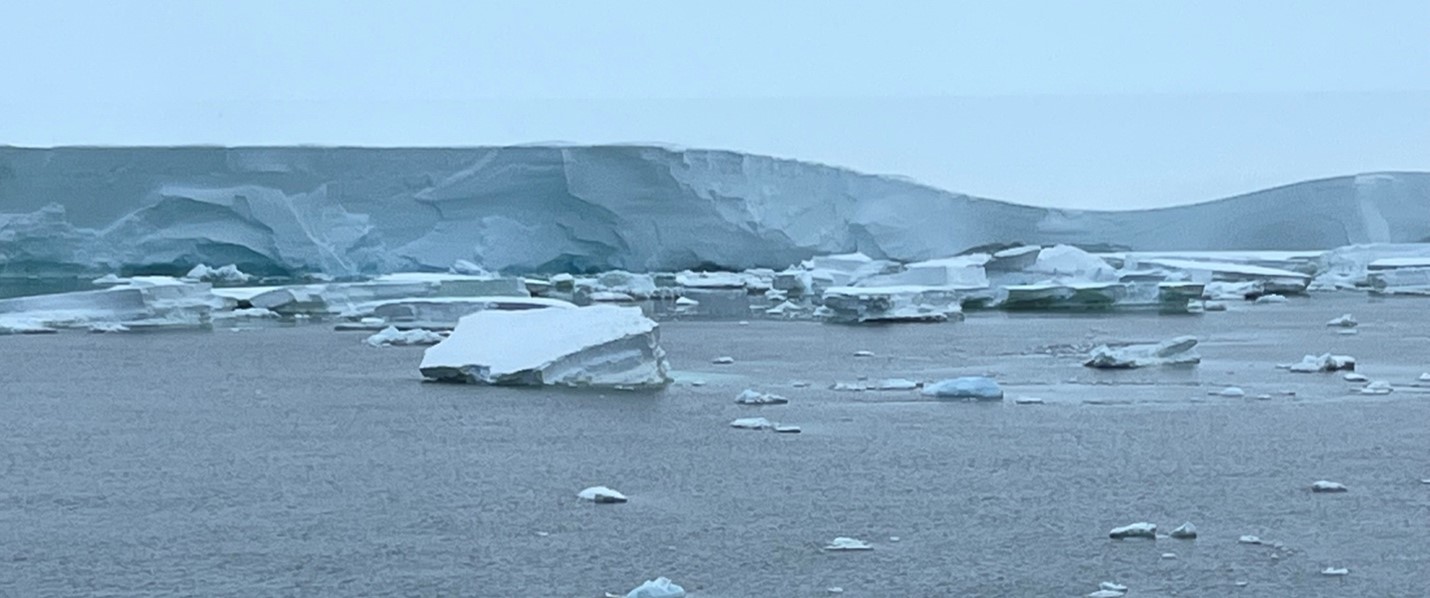
Overall, we found strong evidence for excess heat and meltwater in the upper water column of the region. We also observed a large number of icebergs and multi-year sea ice floes. The Dotson Ice Shelf looked ragged at the outflow, with a slumped upper surface and a large number of caverns at the water line (Figure 5).

References
2019 St-Laurent, P., P. L. Yager, R. M. Sherrell, H. Oliver, M. S. Dinniman, and S. E. Stammerjohn (2019). Modeling the seasonal cycle of iron and carbon fluxes in the Amundsen Sea Polynya, Antarctica. J. Geophys. Res: Oceans. doi: 10.1029/2018JC014773
2017 Scambos, T. A., R. E. Bell, R. B. Alley, S. Anandakrishnan, D. H. Bromwich, K. Brunt, K. Christianson, T. Creyts, S. B. Das, R. DeConto, P. Dutrieux, H. A. Fricker, D. Holland, J. MacGregor, B. Medley, J. P. Nicolas, D. Pollard, M. R. Siegfried, A. M. Smith, E. J. Steig, L. D. Trusel, D. G. Vaughan, P. L. Yager (2017). How much, how fast? A science review and outlook for research on the instability of Antarctica's Thwaites Glacier in the 21st century. Global and Planetary Change 153: 16–34. doi: 10.1016/j.gloplacha.2017.04.008.
2017 St-Laurent, P., P. L. Yager, R. M. Sherrell, S. E. Stammerjohn, and M. S. Dinniman (2017). Pathways and supply of dissolved iron in the Amundsen Sea (Antarctica). J. Geophys. Res: Oceans 122, doi: 10.1002/2017JC013162.